Highlights
- Balkrishna Industries is a market leader in the niche tyre segment, catering to heavy machinery in the mining and agricultural segment. Apollo Tyres caters mainly to the passenger vehicles segment with a growing focus on the premium category.
- Balkrishna has proven to be fundamentally sound, with high margins (<20%) and return ratios delivered consistently. Apollo Tyres is a financially strong company, but the margins are relatively weaker than Balkrishna’s.
- Compared to global peers, Balkrishna enjoys a considerable cost advantage passed onto customers through discounts. Lower interest by Chinese manufacturers in the OTH segment helps continue the cost advantage in favour of Balkrishna.
- Impressive Capex has been undertaken over the last few years by Balkrishna, which is expected to yield results from FY24 onwards. As of March 2022, Balkrishna had a capex WIP of Rs. 1258.40 cr vis-à-vis Rs. 548.03 cr of capex WIP by Apollo Tyres.
Tyre Industry
Tyre is a crucial element in the automobile industry. Without it, almost every other automobile industry would cease to work unless other alternatives are discovered. According to a report by Invest India, the country is expected to become the third largest automotive market in the world by 2026. And to foster the growth of the industry, Government has schemes like the Atmanirbhar Bharat Abhigyan to boost the manufacturing industry, including the tyre manufacturing industry.
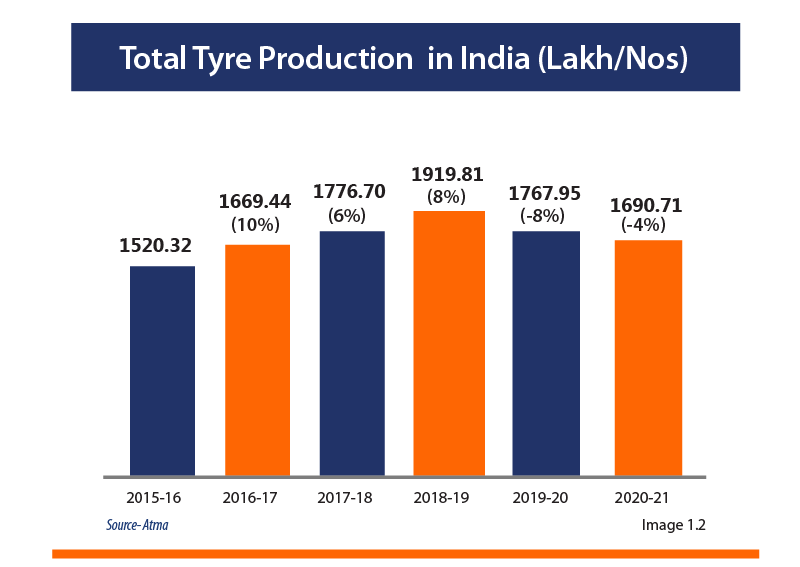
The industry can be categorized based on the type of vehicle, out of which, wheeler tyre production and wheel production for Passenger cars tops the list comprising 2/3 weightage. As shared in the Image 1.2, the present market value of the industry stands at 179.2 million units as of 2022, and the industry is expected to grow by 2028 at a CAGR of 3.7% taking the total units produced
per year to 222.85 million units.
Balkrishna Industries Ltd
The origins of the company date back to 1954, when its visionary founder Mahabirprasad Poddar started the production of bicycle tyres due to the increased demand in the mobility industry.
Skipping to 1987, the company was officially launched as a tyre company and became an international off-highway tyres business in 1995. The small business started by manufacturing bicycle tyres and soon became a global player. This set the motion for a thriving family business for future generations.
From its Q3 results for FY 22 – 23, the company’s revenue has increased by 5.9% from Q3 of last year (Rs. 20.45 billion) to Rs 21.7 billion. The company has expanded its operation to 130 countries, even though most of its revenue generates around from the North American and European markets (69%). The company’s share price has climbed by 26% annually over the past three years, much faster than the 15% average annual growth in earnings per share.
Balakrishna’s Growth Strategy –
The strategy followed by the management at Balkrishna has been based on the foundation of local production and global sales. The focus of the Company has always been on Off-Highway Tyres (OHT) segment in the global market as it had two key advantages – a growing talent pool and access to cheap labour. This was against international competition, grappling with an expensive workforce and exceeding cost overruns. Some of the key growth strategies adopted by the Company include :
- Market Reach – The Company is always on the lookout to increase its market reach expanding to the global market existing sales channel along with increasing reach for original equipment manufacturers and replacement segments. With the help of a distribution network across the Americas, Europe, India and the Rest of the World, the company can sell its products to over 160 countries today.
- Product Portfolio Expansion – One of the Company’s key strategies is to
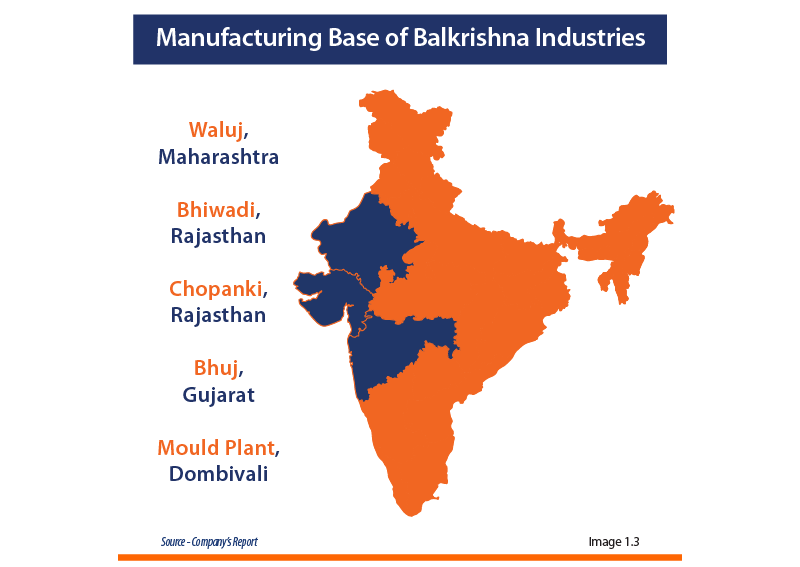
expand its product portfolio by adding large tyres. Over the years, the Company has developed a deeper understanding of the OHT market, which has led to the development of over 2700 SKUs. Further, the installed capacity has increased to the present level of 285,000 MTPA. - Capacity Expansion – The Company has been aggressively pursuing forward and backward integration in its field by expanding greenfield and brownfield projects. The Capex program of Rs. 1900 cr has been undertaken since 2019. The greenfield expansion at Waluj was commissioned in 2022, while another brownfield expansion at Bhuj is advanced.
Apollo Tyres
Apollo Tyres, one of the leading market players in their segment, was founded on 28th September 1972, and began its business on 24th October 1972. The company offered its first market share in 1975 for the public to invest in the company. The company has over 5 manufacturing units in India, one in the Netherlands, and another in Hungary. Apollo and Vredestein are two of the major brands under the company. The company has a product portfolio similar to Balkrishna Industries, which includes passenger cars, SUVs, MUVs, light trucks, truck-bus, two-wheeler, agriculture, industrial, speciality, bicycle and off-the-road tyres, and retreading material and tyres. As of 2023, the company had a market cap of Rs 210.76 billion, generating a total revenue of Rs 2.3 billion. Almost 70% of its revenue is generated from the Asia Pacific, Middle East, and African region, while the rest 30% is from Europe. The stock is trading at Rs 331.80, a decrease of 0.73% in value from last year.
Apollo’s Growth Strategy –
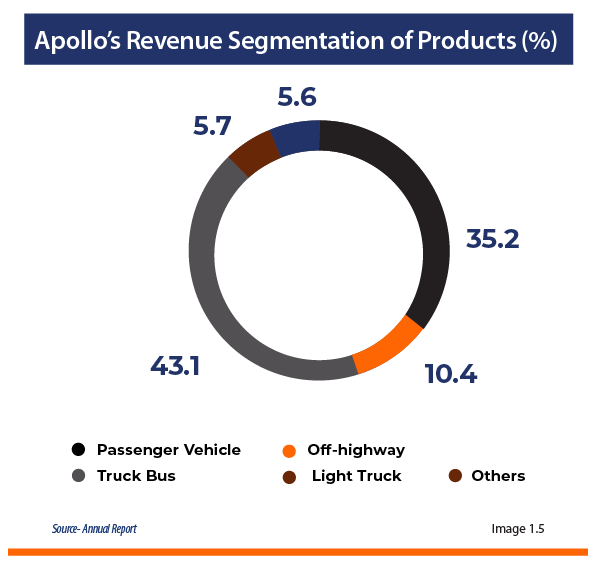
India and Europe form the critical market for Apollo Tyres. Apollo tyres concentrate mainly on passenger cars, SUVs, LCVs, HCV, and agricultural types. While a small portfolio is also dedicated to the OHT segment, that is not the primary segment. Accordingly, its target market is diversified across countries, including about a quarter of the revenue generated from the domestic Indian market. In the European market, the company has adopted the ‘premiumisation’ strategy focusing on particular products that are more profitable and cater to a niche segment. Unlike other players like Balkrishna, Apollo also has manufacturing units outside India i.e. one in the Netherlands and another in Hungary.
Balkrishna Industries vs Apollo
Balkrishna and Apollo have been doing reasonably well in growth and profitability. Recently, the stocks of both companies witnessed a bull run even though the overall market was shaky. This was because of the slippage in rubber prices – the primary raw material. In April 2022, the cost of rubber
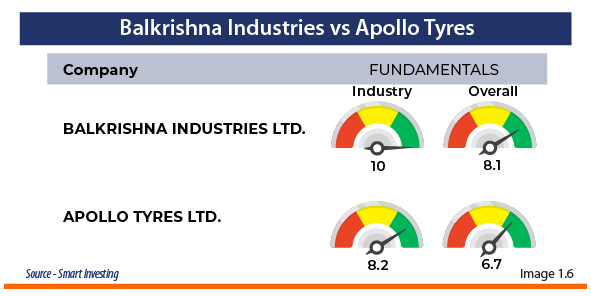
skyrocketed to JPY 275/kg, but by December 2022, it cooled down to JPY 241.50/kg registering a 12% reduction and sending prices of related stocks higher. The image 1.6 & 1.7 contains the comparisan of both companies on a comparative basis, Balkrishna has a higher market capitalization than Apollo, fares better from the long-term perspective. The fundamentals of the Company are also more robust compared to industry averages and on an overall basis with Apollo Tyres.

Some of the factors which augur in favour of Balkrishna as compared to Apollo are given below:
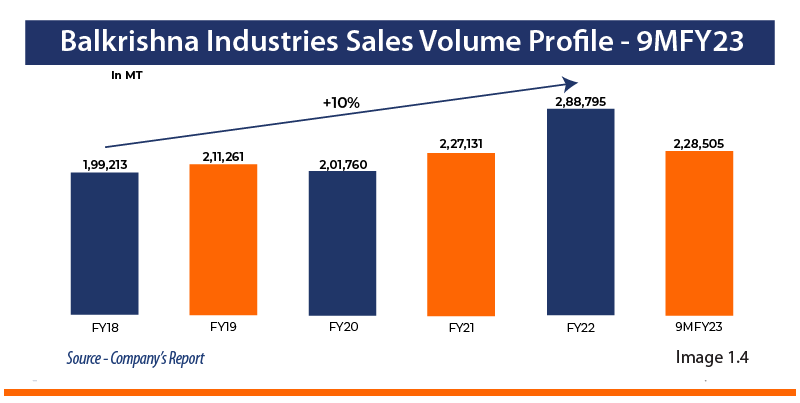
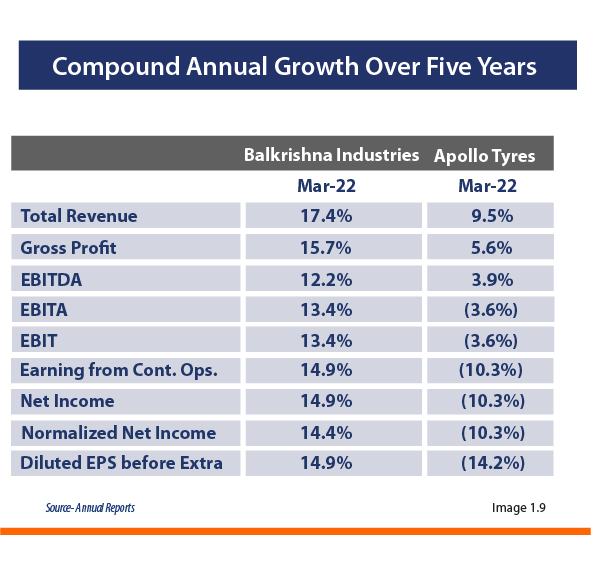
- Over the last five years i.e. from 2018 to 2022, Balkrishna has reported a robust and consistent growth rate of about 13% in topline as compared to Apollo which has been growing with a CAGR of 7% during the same period.
The trend is reflected in the profitability too. While on one hand, Balkrishna has registered a CAGR of 14.30% from 2018 to 2022, the bottom line of Apollo registered a degrowth of 2.47% in the period under consideration. - Balkrishna’s growth in volume terms has been considerably independent of agri commodity prices and is rather being fueled by a combination of portfolio expansion, improved market share and new additions to geographies. Apollo Tyres, on the other hand, is more reliant on the passenger car segment where the demand has witnessed a slowdown during the pandemic as well as post-pandemic disorders. Unlike Balkrishna, which is into OTH tyres and demand is recovering faster, the passenger vehicle demand is yet to pick up steam.
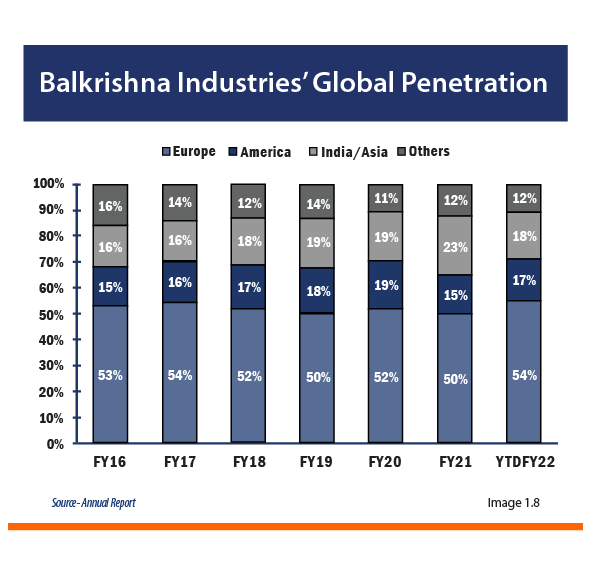
- Balkrishna is pushing to garner a higher market share with a heavy marketing budget of Rs. 334 cr per annum (average of last two years). The penetration in the EU market has increased over the years aided by higher ad spending as shown in the image 1.8.
Apollo Tyres on the other hand is spending lesser on the marketing budget. The average spending on marketing, advertisement, sales promotion, discounts etc was Rs. 228 cr. Balkrishna spent 46% more than this amount which shows the intensity with which Balkrishna wants to penetrate the new markets.
- Balkrishna is under heavy capex mode since 2019. With capex per sale of about 10-12% and a payout ratio in the range of 30% -40%, the Company has generated Free Cash Flow/ Sales at about 3-4%. The heavy investments in capex are expected to last till FY23E and will lead to strong growth and deeper backward integration. The Free Cash Flow is now improving as the capex is on the verge of completion and this will support the improvement in share prices over the next couple of years.
As of 31st March 2022, Balkrishna had a total Capex work in progress of Rs.1258.40 cr as against the Capex Work in Progress of Rs.548.03 cr for Apollo Tyres as on 31st March 2022. This emphasizes the growth strategy that while both Companies are growing, the growth targeted by Balkrishna is at a higher pace. Of this capex amount, Balkrishna is expected to complete 72% of the Capex in less than a year.
One of the major advantages touted in favour of Balkrishna is the cost arbitration advantage it enjoys against its global peers. This allows the company to quote discounted prices helping it to churn RoCE of 20-25%. Exports constitute a lion’s share of its total revenue at about 83%. This is further supported by a strong channel mix with replacement accounting for about 70% while OEM share is at close to 28%. In terms of volumes, agriculture accounts for about 63% while another 34% is contributed by the OTR. These have contributed to consistently high margins and strong return ratios. Apollo tyres, on the other hand, is in the passenger vehicle segment which faces stiff competition from Chinese manufacturers. The passenger vehicle tyre segment confirms the bulk production system which is preferred by the Chinese manufacturer. Against this, the OTH market is less of bulk production and more of customization which makes the Chinese manufacturer less interested in this segment and it goes in favour of players like Balkrishna.
Future Expectations
Apollo Tyres as well as Balkrishna Industries are a stalwart in the tyre sector in India. They both compete for different customer bases and some different markets as well. With the growth in the Indian economy, constituent companies are also expected to register strong growth.
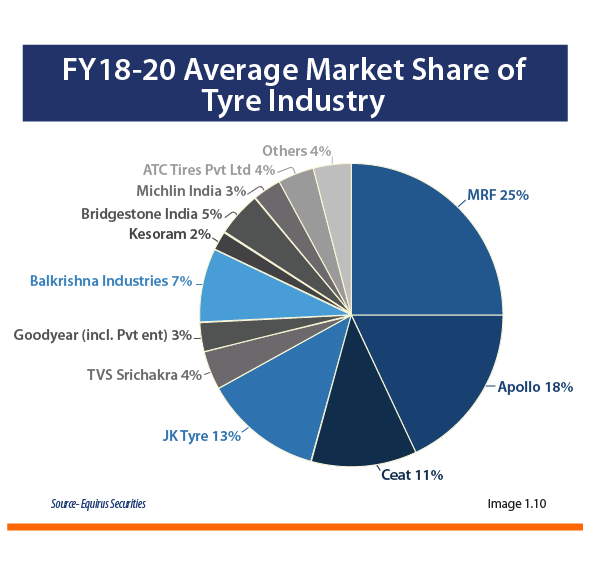
As seen on image 1.10, even though Apollo Tyres commands the lion’s share in the domestic market, in terms of the financial trajectory, the CAGR for essential items over the past 5 years has been going south for Apollo Tyres. Sales growth has been in the single digit, while profit growth has been negative. Balkrishna Industries, on the other hand, have posted remarkable growth over the past 5
years, with all key parameters registering a double-digit growth rate.
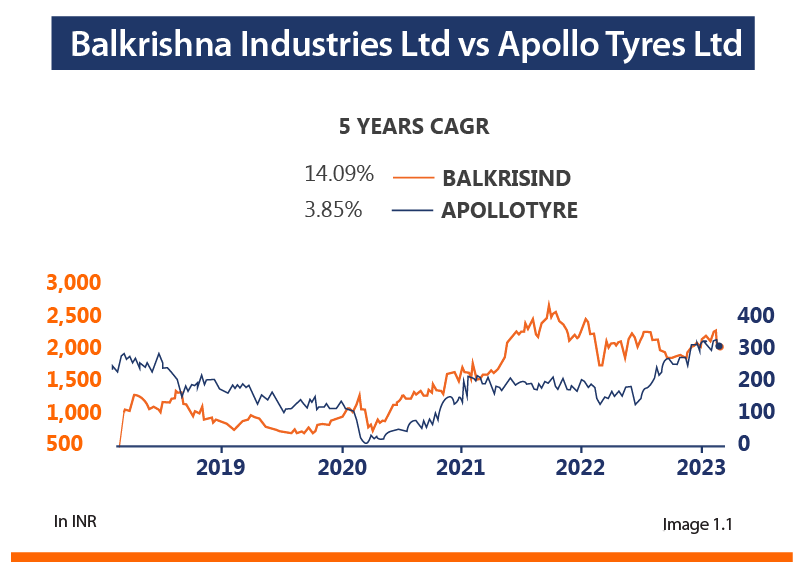
In terms of share price in image 1.1, the return from Balkrishna Industries over the past 5 years was 98.37% (as of Feb 2023) as against the return of 22.88% generated by Apollo Tyres during the same period under consideration.
Hence, going by the historical trend in share prices and solid financial foundation as an estimate for future projection, it can be concluded that Balkrishna is poised for more vigorous and fundamentally more sound growth in the near future as compared to its rival Apollo Tyres.
Conclusion
The Q3FY23 financials of the Company has suffered a significant setback with a 70% decline on a Y-o Y basis in earnings on account of higher raw material cost and weaker demand as the key markets in the US and Europe brace for a recessionary trend. However, these developments are only transient, and operational costs (freight and raw material) are expected to reduce significantly in the ensuing year ahead. The Company continues to enjoy a considerable cost advantage compared to its global peers, which is the economic moat that will help the Company grow further. The expected reduction in operational cost is projected to the tune of 300 basis points and will be visible from Q1FY24 onwards. The Capex for YTDFY23 was Rs.13 billion, and only minor capex is expected in Q4. Hence, from FY24 onwards, the Capex will subside, FCF will increase, and the benefit of capex will be reaped after that. As of 30th September 2022, the Company had Gross Cash and Cash Equivalent of Rs.2,078 cr. It is self-reliant for Carbon Black (an essential input for Tyre Manufacturing), while for other raw materials, it has diversified sources. With high operating margin and return ratios, the Company has developed an anti-commodity-type of behaviour. Any price dip on account of global cues will present a buying opportunity for the Company.